What is statistical significance?
Anyone interested in research, be it experiments testing the effects of new medications or studies of human behaviour, is bound to eventually encounter the term statistical significance. Despite being a fundamental feature of research, the concept of statistical significance is often a source of confusion beyond the laboratories and classrooms in which it is frequently discussed. This confusion stems partially from the fact that the word “significant” has different meanings in and outside of research. In everyday language, the term significant typically refers to something important or considerable. Significance in research, or statistical significance, refers to the likelihood that a result can be explained by chance. The distinction between statistically significant and important should not be overlooked – a result that is not statistically significant may still be quite meaningful and have far-reaching implications!
Research findings are always a matter of probability, not certainty. Researchers can never be entirely sure of a particular finding; they can only have some degree of confidence in it. Statistical significance relates to the amount of confidence that a researcher can have in a given result and whether this confidence is sufficient to accept the result as accurate.

How do researchers evaluate statistical significance?
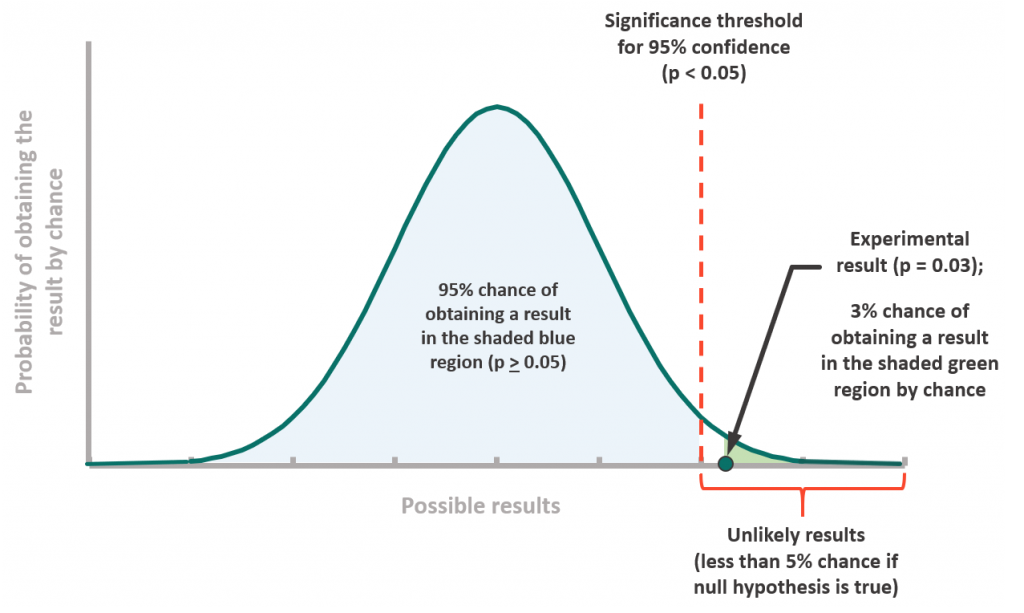
Researchers evaluate statistical significance through hypothesis testing, in which one tests data against a null hypothesis. For any experiment, the null hypothesis essentially states that there is no real difference between groups of interest. Accordingly, if the null hypothesis is true, any observed group differences can be attributed to chance. Hypothesis testing yields a test statistic called a p-value, which represents the probability of obtaining a result as or more extreme as that observed if the null hypothesis were true. The larger the p-value (from 0 to 1), the more likely the corresponding result occurred by chance.
Researchers often set their criterion for statistical significance at p<0.05, meaning that they will accept a result as significant if there is less than a 5% chance of obtaining it by chance. When a p-value is larger than the cut-off value for statistical significance, the data is considered to be consistent with the null hypothesis and unlikely to contain real relationships between variables of interest. Conversely, when a p-value is less than the cut-off value for significance, we can conclude that the finding is due to a real relationship between variables. In other words, we can reject the null hypothesis.
Why is statistical significance important?
Consider a researcher interested in whether a new drug improves motor control in adults with cerebellar ataxia. She runs an experiment in which half of the participants receives the new drug and the other half receives a placebo (which does nothing). She observes improved SARA scores in the participants who received the drug compared to those who received the placebo. This finding may indicate that the drug improves motor control. Alternatively, this finding may simply have occurred by chance, perhaps due to lucky sampling and group assignment. To determine whether the improvement in SARA scores is significant, the researcher must compare the p-value associated with the result to her criterion for significance. For example, if the p-value is 0.03 and the criterion for significance is p<0.05, the researcher can conclude with 95% certainty that the result is statistically significant, and there is a real relationship between the drug and improved SARA scores.

A researcher can be more or less conservative in estimating statistical significance by applying different criteria. For instance, if we set the criterion for significance at p<0.01, we accept values as significant only if we would expect them to occur less than 1% of the time by chance. The criterion for statistical significance dictates how confident we can be in a given result. Understanding statistical significance thus allows us to make sound judgements about research findings and, in turn, how we invest our time, energy, and money.
To learn more about statistical significance, check out these articles and videos from Laerd Statistics and Khan Academy.
Snapshot written by Dr. Chloe Soutar and edited by Celeste Suart


