
Written by Carrie Sheeler, PhD
Edited by Celeste Suart, PhD
Advances in wearable technology for tracking ataxia severity combine coordination changes across different types of movement.
How do you know a new treatment is working? This is the key question that clinicians have to answer when developing and testing new therapies. One on one, a patient and doctor can discuss symptoms, track improvements in movement and coordination, and decide on future directions together. But how do you know if a new treatment is working across many different doctors and patients? Clinical trials constantly seek out ways to understand how treatments affect an entire patient population. Confidence in results requires consistent ways to measure and assess outcomes across a range of clinics and patients. To account for this variability, clinicians use tests like the International Cooperative Ataxia Rating Scale (ICARS), Scale for the Assessment and Rating of Ataxia (SARA), and Brief Ataxia Rating Scale (BARS), which describe specific movements for doctors to observe and score. These clinical tests are designed to set a standard of assessment for clinicians and consistently represent the progressive worsening of symptoms with heritable ataxias.
Clinical scoring is effective, but there are ways to innovate this system. Some aspects of note include:
- Clinical visits required. Because clinical scoring requires clinician insight, regular monitoring as part of a clinical trial requires regular visits with a doctor or research staff. This can put additional burden on patients with ataxia and their families. Developing strategies for reliable home testing reduces this travel burden and improves clinician’s ability to track patients over time.
- Variability between clinics and clinicians. Because scores are ultimately dependent on the observer doing the scoring, this introduces potential variability between clinics and clinicians. This could depend on the observer’s familiarity with ataxia or their recent experiences and observations. Developing a way to measure changes in movement and coordination that doesn’t rely on observer insight may help to reduce variability in collected data. This could help clinicians tell if a potential treatment is working.
- Scored tests create artificial floors and ceilings. Have you ever been asked to rate something from 1 to 10 and been tempted to say 11? Or 0? If so, you can see that a key drawback in numerical ranking is the assignment of artificial caps. These are called artificial “floors” for the low end of the range and “ceilings” for the high end of the range. Clinical scoring systems make their systems broadly applicable by having clearly written definitions for each score on the scale, but by doing this they collapse the full extent of movement and coordination changes into a limited range that can be maxed out. Developing a tool to measure movement and coordination changes in a continuum, i.e. with no set score ranks and no caps, allows for more nuanced tracking of a patient’s changing symptoms over time and also removes any arbitrary maximums from scoring.
In 2021, Dr. Gupta’s lab developed and tested a wearable wrist device that tracked movement during a finger-to-nose test. The device works like an accelerometer, measuring changes in direction and speed in three dimensions. They found qualities of the sensor’s movement during the test (referred to as “submovements” in this and other papers from this lab, see the glossary for a more detailed description) correlated well with a patient’s BARS score. This suggests that this tool could be useful as a supplement for current scoring practices or for symptom monitoring outside of the clinic (Oubre et al 2021). While this was promising, that study only assessed the wrist sensor with one movement test (finger-to-nose). This left several questions that the researchers wanted to address. First, are some movement tests more sensitive than others? For example, how different is movement data from a finger-to-nose test when compared to a different arm movement or even a leg movement? Then, with future clinical trials in mind, how should movement data from multiple unique movement tests be combined to best represent the severity of a patient’s ataxia?
To answer these questions, the researchers asked study participants to wear movement sensors to track arm and leg movement during five established movement tests. This included the finger-to-nose, finger-chase, heel-stomp, heel-shin, and fast alternating hand movements (AHM) tasks. Participants also completed the BARS test to get a clinical score of ataxia severity. 27 participants without ataxia and 70 participants with ataxia were included in the study, representing a range of ages with an average age of 41 years old in the former group and 57 years old in the latter. Participants with Ataxia represented over 30 different diagnoses, including spinocerebellar ataxia (SCA) types 1, 2, 3, 6, 7, 8, and 14, Ataxia Telangiectasia (A-T), Autosomal recessive ataxia (ARCA) 1 and 3, Multisystem Atrophy – Cerebellar type (MSA–C), Hereditary Spastic Paraplegia (HSP), and others. This inclusion is useful as it helps demonstrate how representative these wrist sensor results might be for different underlying causes of ataxia.
They compiled movement data from all 5 tests and observed how the main components of movement for each task compared to one another (For example, comparing the finger movement from nose to target versus from target to nose in finger-to-nose task or up versus down movement of the ankle in the heel stomp task). The researchers found that different limbs (wrist versus ankle) and different movement tasks on the same limb (finger-to-nose versus finger chase) result in movements that are mathematically distinct. Interestingly, the type of movement was a better distinguishing feature than ataxia severity. This means that when we’re comparing the submovement profiles from each of the 5 tested movements for participants with and without ataxia, the difference in wrist movement between the finger-to-nose and finger chase tests is more apparent than the effect of ataxia. This suggests that ataxia affects each movement test in a slightly different way. As such, a broad overview of the data might not be able to clearly distinguish small changes in ataxia progression. The researchers then dug into the characteristics of the submovements for each task. They found that there were specific characteristics for each task that appeared to be more affected in participants with ataxia. This demonstrates that the movements of different limbs change in unique ways when a participant has ataxia.
The impact of ataxia on different submovement characteristics seems to be specific to the limb and test type. Because of this, combining movement data from across different movement tasks will require a more nuanced approach than just averaging or adding values to make a single metric. To accomplish this, the researchers developed a mathematical model that was able to consider both the type of task and the specific submovement within that task to predict the severity of a participant’s ataxia. They tested the reliability of this model against clinical BARS scores and found that it correlated well. This suggests that the movement sensor data could be used to measure ataxia severity.
In summary, the newest paper from the Gupta Lab (Patel et al 2025) builds on previous work studying the usefulness of wearable movement sensors in assessing ataxia severity. They had study participants perform 5 movement tests commonly used in the clinic that require coordinated arm or leg use. They found that ataxia caused unique changes in movement for each test. This suggests that ataxia differently affects different limbs or movements within the same limb.
This isn’t an entirely surprising finding. Though the whole body experiences reduced coordination in ataxia, the gestures performed during the tested movements use different muscle groups which require unique brain inputs to coordinate them. To best represent ataxia severity using the sensor data, the researchers developed a mathematical model that takes movement data from the sensor and combines it with information about the type of movement tested. The predictions from this model correlate well with clinician BARS scores. This suggests that this model can be used with the sensors for future research tracking ataxia severity either as a part of a clinical trial. It could even be a way for clinicians to track ataxia progression through at-home monitoring. Dr. Gupta and his team are continuing to research how wearable movement sensors could be used for ataxia symptom monitoring.
Key Words
Brief Ataxia Rating Scale (BARS): This is a clinical test similar to the International Cooperative Ataxia Rating Scale (ICARS) or Modified International Cooperative Ataxia Rating Scale (MICARS). The ICARS is a long test capable of identifying cerebellar and non-cerebellar aspects of ataxia. BARS was developed in 2009 to create a shorter and simpler version of the test by testing only 5 key aspects of movement- gait, knee-tibia test (raising and lowering of the heel), finger-to-nose test, dysarthria (slurred speech), and oculomotor (eye) movements. It is comparable to the Scale for the Assessment and Rating of Ataxia (SARA). (Schmahmann et al 2009)
Finger-to-Nose Test: This tests movement coordination and the function of the cerebellum (a region of the brain that is commonly but not always affected in cases of ataxia). During the test, the participant is asked to repeatedly touch their nose and then a target with a shifting position in front of them.
Finger-Chase Test: This tests movement coordination and the function of the cerebellum (a region of the brain that is commonly but not always affected in cases of ataxia). During the test, the participant fully extends their arm with a finger pointed and follows a target that alternates from left to right.
Heel-Stomp Test: This tests coordination and proprioception (the ability to sense where the body is in space). During the test, participants repeatedly lift their knee and stomp their heel for about 15 seconds.
Heel-Shin Test: This tests movement coordination and the function of the cerebellum (a region of the brain that is commonly but not always affected in cases of ataxia). During the test, seated participants place the foot of one leg onto the knee of the opposite leg, then slide that foot down to the ankle and back up to the knee again along the length of the shin.
Fast Alternating Hand Movements (AHM) Test: This tests movement coordination and the function of the cerebellum (a region of the brain that is commonly but not always affected in cases of ataxia). There are many ways this test could be performed, including with finger tapping, or flipping hands from a palm-up to a palm-down position. In this paper, participants were tested by having them extend their arms (one at a time) straight out in front of them, palm facing directly away from them, and then tilting their hand from left to right as though waving.
Submovements: An accelerometer measures changes in velocity (speed) over time in three-dimensional space. Three-dimensional space is difficult to work with mathematically, so the researchers broke this down using principal component analysis. This technique takes a large data set and simplifies it, highlighting major factors that seem to be driving the most change in the data. Talking about math gets really abstract really fast, so I’m going to try and explain it with an example. In the context of a finger-to-nose test, the participant alternately touches their nose with their finger and then touches a target in the environment (a spot on a tablet, a clinician’s pencil eraser, another person’s finger, etc). You can try that now, picking something close to you. While you do that movement, your wrist undergoes several kinds of movement. The biggest changes are the forward movement of your hand toward the target and the reverse movement of your hand back toward your face. There are also subtle movements happening at the same time. Perhaps the movement is not perfectly smooth as you go from one point to the other, and there is some quavering side to side or some stopping and starting. Maybe your wrist is twisting to face you and then face your target as you move your hand. Maybe you even get distracted because you’re reading at the same time, and your arm drifts off to one side. All of these add complexity to the big movement of your nose (and associated wrist) going back and forth from nose to target. Principal component analysis is a way to incorporate all of those little nuances and rank which of these movements are the “biggest” and most impactful to the overall understanding of where your hand is in space. So, when the researchers apply this technique to the data, they can pull out the biggest movement component (let’s say forward movement, toward the target) and the second biggest movement component (reverse movement, away from the target) and plot these over time. The result is a graph of speed over time that looks a lot like a wave, continually going up and down as you go from left to right. “Submovements” on this graph are represented by each distinct curve (when the line leaves 0 and returns to 0 again). These serve as the basis for further analysis for specific properties like duration (how long did it take you to finish complete a directional movement?), distance (how far did you move your arm?), fastest average speed, and quickest acceleration. If you would like a good representation of what this curve looks like, I recommend checking out the first figure in the Oubre et al 2021 paper I cited. It has a nice picture of the finger-to-nose test, the resulting graphs they make, and how those graphs compare between different BARS scores (i.e. with worsening ataxia).
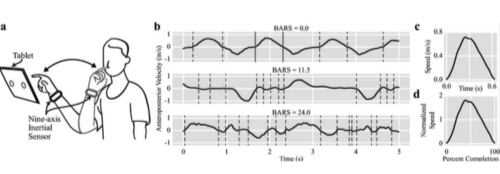
Figure 1 from Oubre et al, Cerebellum, 2021. Used under Creative Commons Attribution 4.0 International License.
It’s worth noting that while all of the three-dimensional wrist movement data is put into the initial principal component analysis, the only data that is analyzed after that point pertains to the largest two movements (in the example above our forward and reverse directions). The “flattening” effect of the principal component analysis means that subtle differences in movement quality (wrist turning or off-target drifting of your arm) will no longer be represented in the analyzed data and, moreover, would be hard to identify consistently between individuals.
t-SNE: If you have looked through the paper, you have seen that figures 1 and 3 have graphs with a lot of dots with “t-SNE one” and “t-SNE two” written on the axes. t-SNE stands for t-distributed stochastic neighbor embedding. This is a technique used to take a large data set and simplify it (similar to principal component analysis, if you read through “submovements” above). This technique allows researchers to take big data sets representing many participants and their test results and see how they compare to one another. Each dot represents a specific kind of submovement data for one participant (so, for example, the forward movement of participant #1’s finger in the finger-to-nose test is one dot). If a dot is located close to that dot, it is mathematically similar. The farther away a dot gets from another dot, the more mathematically different those represented samples are. Shading or color are used to help understand the variables that could be affecting the data, which can include ataxia diagnosis/severity, type of test, or specific submovement.
Conflict of Interest Statement
The author and editor have no conflicts of interest to declare.
Citation of Article Reviewed
Patel S, Oubre B, Stephen CD, Schmahmann JD, Gupta AS. Submovements Derived from Wearable Sensors Capture Ataxia Severity and Differ Across Motor Tasks and Directions of Motion. Cerebellum. 2025 Sep 16;24(6):156. doi: 10.1007/s12311-025-01901-3. PMID: 40956472.
(https://pubmed.ncbi.nlm.nih.gov/40956472/)
Citation of Additional References
Oubre B, Daneault JF, Whritenour K, Khan NC, Stephen CD, Schmahmann JD, Lee SI, Gupta AS. Decomposition of Reaching Movements Enables Detection and Measurement of Ataxia. Cerebellum. 2021 Dec;20(6):811-822. doi: 10.1007/s12311-021-01247-6. Epub 2021 Mar 2. PMID: 33651372; PMCID: PMC8674173.
(https://pubmed.ncbi.nlm.nih.gov/33651372/)
Schmahmann JD, Gardner R, MacMore J, Vangel MG. Development of a brief ataxia rating scale (BARS) based on a modified form of the ICARS. Mov Disord. 2009 Sep 15;24(12):1820-8. doi: 10.1002/mds.22681. PMID: 19562773; PMCID: PMC3800087.
(https://pmc.ncbi.nlm.nih.gov/articles/PMC3800087/)
Read Other SCAsource Summary Articles

The influence of age on the severity of SCA2
Written by Ross Pelzel Edited by Dr. Larissa Nitschke New mouse studies show that mutant ataxin-2 causes dramatically more damage in older animals, revealing aging as an independent driver of disease severity In Read More…


Wearable Sensors Show Daily Walking Differs from Clinic Tests for SCA Patients
Written by Yujia Li Edited by Celeste Suart, PhD Walking test in a hospital is not the same as walking at home. Wearable sensors show that real-world walking is more variable than in the hospital. We don’t usually Read More…
Moving Heals! Exercise and a TrkB Agonist Offer New Hope for SCA6
Written by Élyse Zadigue-Dubé Edited by Priscila Pereira Sena New research in SCA6 mouse models suggests boosting BDNF-TrkB signaling could change the game. Is there a world where an SCA6 Read More…